NFL Prediction System
Honestly-backtested moneyline / spread / total predictions, benchmarked against the closing line.
This week: Week 1, 2026 season
Snapshot generated at 2026-09-14T02:35:29.483768+00:00 (site rebuilt 2026-09-14 02:36 UTC).
This week's suggested parlay
| # | Game | Market | Pick | Model prob. | Market prob. | Edge |
|---|---|---|---|---|---|---|
| 1 | DAL @ NYG | ML | DAL | 60.3% | 60.0% | +0.4pp |
| 2 | DEN @ KC | SPREAD | DEN +2.5 | 52.9% | 50.0% | +2.9pp |
| Combined (2 legs) | Probability | Fair odds (implied, not a real book price) |
|---|---|---|
| Model | 31.9% | +213 |
| Market-implied | 30.0% | +234 |
One leg per game only (highest-probability market for that game), drawn only across different games -- same-game legs (e.g. a team's moneyline and its own spread) aren't independent enough for the combined-probability math to mean anything, so they're never combined here.
Moneyline backtest (walk-forward, leak-free)
| Model | N | Accuracy | Log loss | Brier | ECE |
|---|---|---|---|---|---|
| elo_only (raw) | 4162 | 0.6425 | 0.6321 | 0.2211 | 0.0293 |
| elo_only (isotonic-calibrated) | 4162 | 0.6430 | 0.6633 | 0.2216 | 0.0188 |
| logistic_regression (n=4162) | 4162 | 0.6470 | 0.6262 | 0.2183 | 0.0208 |
| xgboost (nested-CV tuned, n=4162) | 4162 | 0.6497 | 0.6523 | 0.2196 | 0.0210 |
| market_implied (n=4161) | 4161 | 0.6655 | 0.6094 | 0.2110 | 0.0165 |
| home_always (baseline) | 4162 | 0.5543 | 0.6877 | 0.2473 | 0.0168 |
| favorite_always (baseline, n=4161) | 4161 | 0.6657 | |||
| ensemble (logistic+market, n=4162) | 4162 | 0.6648 | 0.6093 | 0.2109 | 0.0146 |
Spread & total backtest (walk-forward, leak-free)
| Market | N | Accuracy | Model MAE | Market MAE | ECE |
|---|---|---|---|---|---|
| Spread (ATS), model only | 4069 | 0.5072 | 10.33 pts | 10.08 pts | 0.0599 |
| Spread (ATS), ensemble | 4069 | 0.5139 | — | — | 0.0042 |
| Total (O/U), model only | 4134 | 0.5160 | 10.61 pts | 10.45 pts | 0.0458 |
| Total (O/U), ensemble | 4134 | 0.5104 | — | — | 0.0205 |
Baselines -- ATS: home-always 0.491, favorite-always 0.489. O/U: always-over 0.496, always-under 0.504. "Ensemble" blends the model with de-vigged market juice (spread/total odds) on the log-odds scale, weights learned walk-forward, same discipline as the moneyline ensemble.
Calibration & home-field advantage
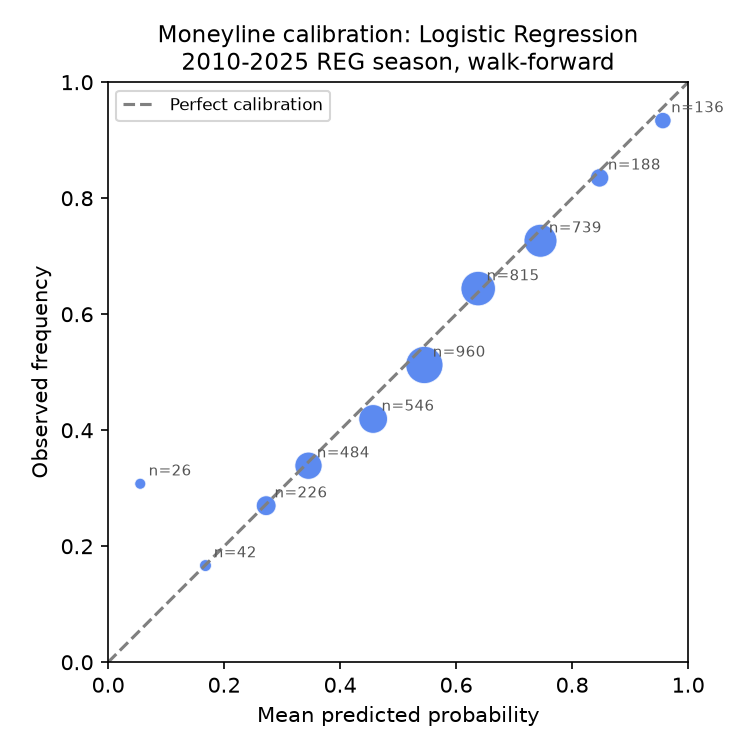
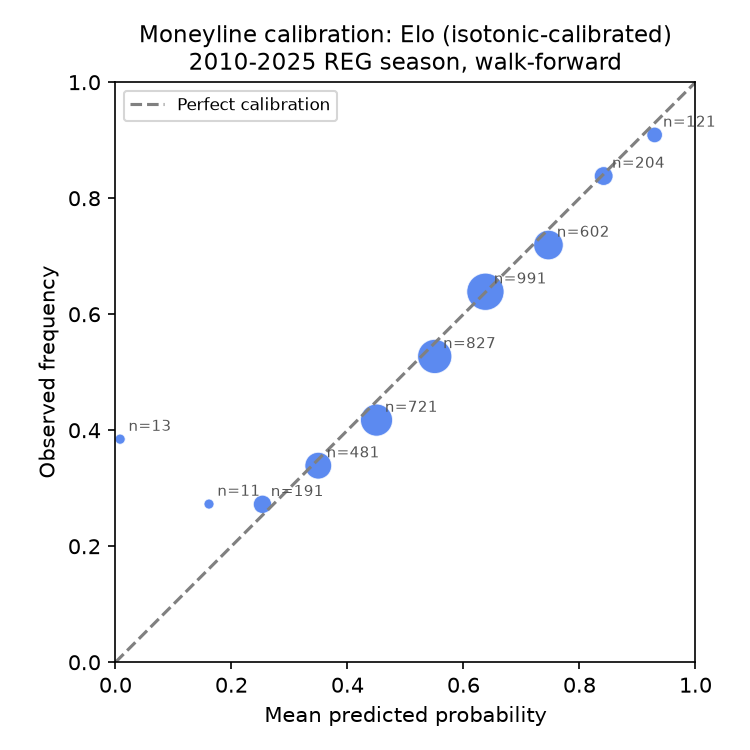
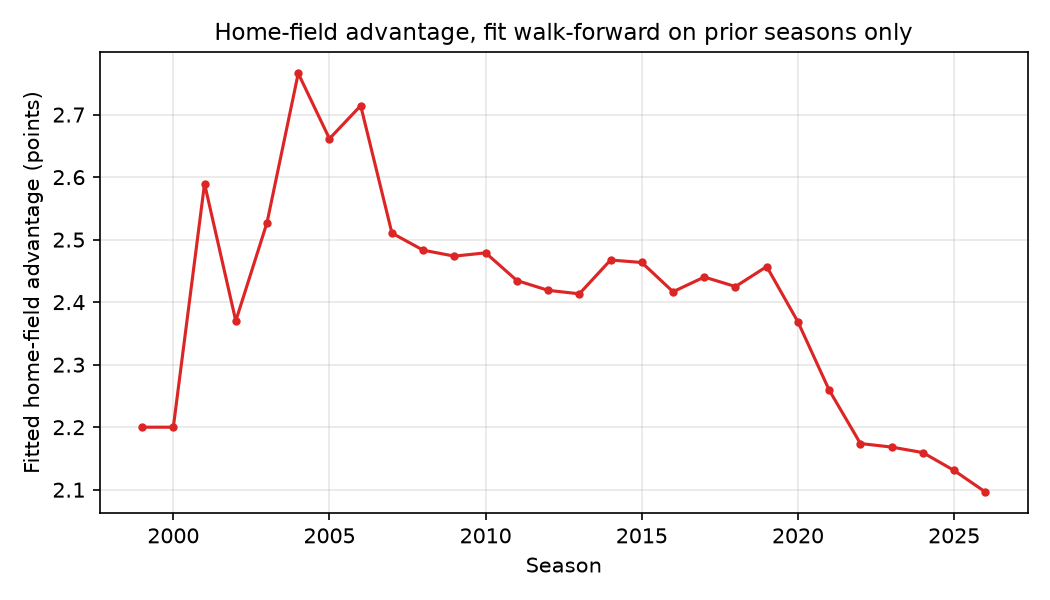
On CLV (closing-line value)
Historical nflverse data provides closing lines only, not opening lines, so true historical CLV
(did we get a better price than where the market closed) cannot be reconstructed retroactively. What the
walk-forward backtest above measures instead is whether the model's calibrated probabilities beat the
market's closing-line-implied probabilities on log loss / Brier / accuracy -- and, as reported above,
they generally do not by a meaningful margin. Starting this week, every prediction snapshot is timestamped
pre-kickoff; as the season progresses we will append realized closing lines to results_log.csv
and publish a genuine prospective CLV chart here.